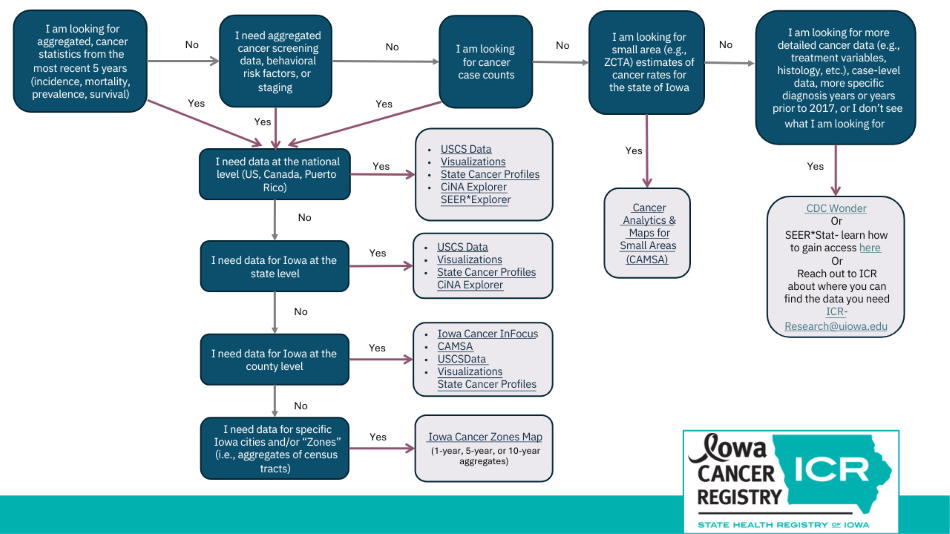
Data Tool Decision Tree
Not sure which tool or resource to use? Use this decision tree to help find the tool(s) that will fit your cancer data needs.
Iowa Cancer InFocus
Cancer InFocus is a data gathering and visualization platform. The suite of tools provides interactive maps where one can examine county-level cancer incidence and mortality data alongside population demographics, social drivers of health, and behavioral risk factors. County Profiles can be generated for individual counties, consolidating all listed data items into a report.
Geography: County, Census-Tract
Data Views: Maps, Downloadable Tables, County Profiles
View tools here: Cancer InFocus
Cancer Analytics & Maps for Small Areas (CAMSA)
CAMSA provides an interactive map where one can examine zip code-level or county-level age-adjusted incidence rate, and risk probability for several cancer sites. Population density for zip code or county-level can also be explored.
Geography: Zip Code Tabulation Areas, County
Data Views: Maps, Tables
View tool here: CAMSA
Iowa Cancer Zones Map
This interactive mapping tool helps one examine cancer incidence and population demographics by zones. The Iowa Cancer Registry identified 48 cancer zones throughout Iowa that combine and/or split counties in meaningful ways for Iowans. For example, some rural counties (where rates would typically be censored due to small counts) have been grouped together in one zone, whereas many of our urban areas have been assigned to their own zone. With these zones the Iowa Cancer Registry aims to provide data for geographies beyond county-level statistics to better serve cancer control, public health, and policy efforts. Zones have been designed so that they have a minimum population of 50,000 residents, have similar demographic and socioeconomic characteristics, and are geographically compact.
Geography: Zones
Data Views: Maps, Downloadable Table
View tool here: Iowa Cancer Zones Map